“We can check that in our Hyperdimensional Data Cube”
If you’re looking for lingo that sounds fancy, makes you look smart and creates and air of mystery about data it’s hard to top a phrase like “Hyperdimensional Data Cube”. What exactly is it? How did your numbers come out of it? Well boss, it’s hard to say, they just sort of do…
Today let’s break apart this concept and explain what’s happening inside. We’ll start by defining the difference between ‘measures’ and ‘dimensions’. I’ll then show you how a cube is a lot like a spreadsheet. And finally we’ll learn how you move around in the cube to access different views of the data
Measures and Dimensions
Measures are what we’re counting. That’s all.
In the example below we’re counting sales dollars. It could easily be number of items sold, number of accounts opened, number of customers who logged in or whatever is meaningful to your work. The key point is that this is a numeric value and we can perform math against it.
Dimensions are the definition of what we’re counting in the measure.
For example, if I ask you “What are the sales dollars” you can’t answer the question; no one can. An answerable question is “What are the sales dollars last week?” Or, “What are the sales dollars last week in the Main St. location?” Now you have two dimensions guiding your answer – Time (last week) and Location (Main St).
Note also that sometimes dimensions are part of a hierarchy. For ‘Time’ we have days that roll up into weeks into months, etc. We’ll come back to that.
If you understand Excel, you can understand a data cube
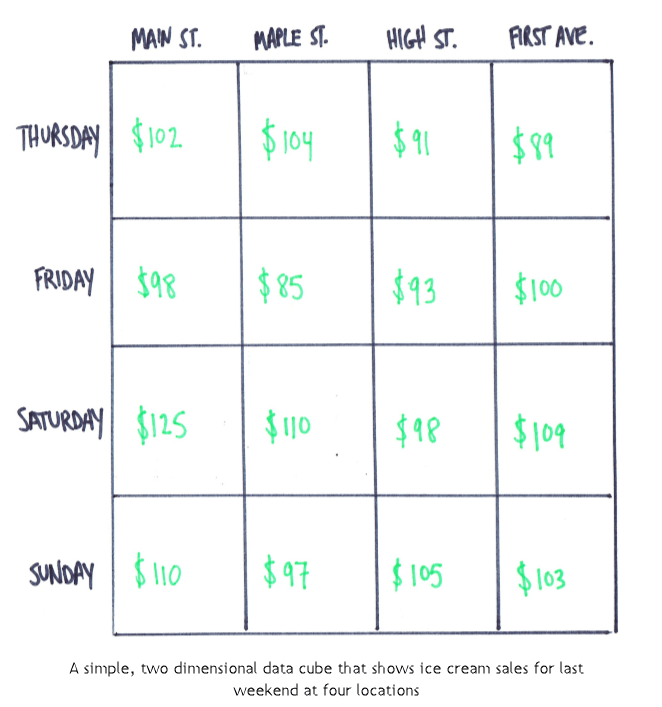
Let’s keep going with that examples above but let’s put them in a spreadsheet layout. Now we’ve got rows (Time) and columns (Location). These are our dimensions. And where the columns intersect, we have measures. This is actually a simple data cube.
If you understand this it’s easy to add a third dimension, let’s say Product, and it looks like this.
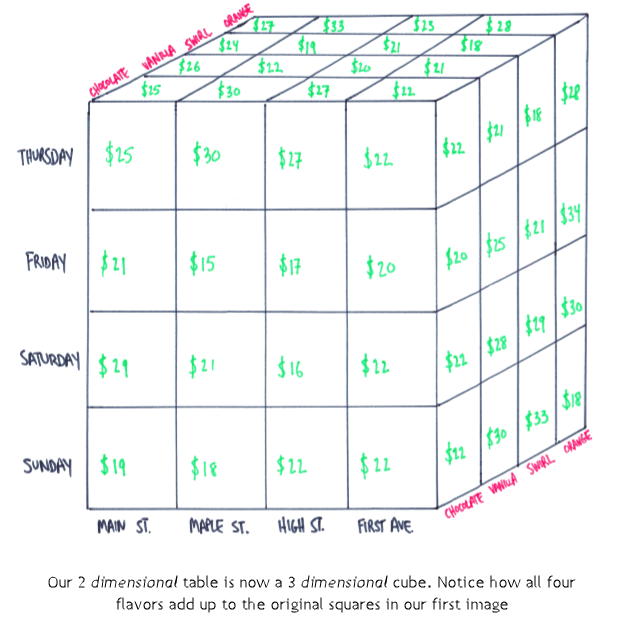
Now we can answer “What were the sales of Product A, last week in the Main St location?”
From here you can add a 4th, 5th and 6th dimension and this becomes a multidimensional cube or a hyperdimensonal cube. We can’t visualize or draw it at this point but if you followed the above you get the idea. I’ve seen cubes with over 30 dimensions.
We’re not limited to only one measure either. We can store several measures in each of the intersections like “Average Sale Size” or “Number of Items Sold” or “Number of Customers Who Shopped”.
Hierarchies – moving around the cube
The most basic and intuitive action on a cube is called slicing. This just means that you filter the data. In our example above ( “What are the sales dollars last week in the Main St. location?”) we are slicing on two things: first by Location, specifically saying location is Main St. and secondly by Time, specifically last week. Later in our example we added a slice where Product was equal to vanilla.
I mentioned above that some dimensions have an additional quality about themselves, they are part of a hierarchy. A hierarchy is the definition of how the data relates to itself. Calendar is an easy one: Days roll up to months, which roll up to quarters then years. Or store locations roll up to districts which roll up to regions.
Our report shows sales last week in the Main St. location. A natural follow up question would be to ask what it looks like for the month. Or maybe day-by-day. With a data cube you can quickly move up and down and hierarchy to make these recalcuations.
Moving around the hierarchy is called ‘rolling up’ and ‘drilling down’. Go back to our report question: What are the sales of vanilla last week in the High St location? With a click in your BI tool you can drill down into the 7 days of the week individually. Or you can roll up to the full month.
What’s happening under the covers is that the cube holds all this information at the lowest level. For this example, that’s down to the single day, single store, single product. When you ask for the last week of sales for vanilla in the High St location the cube figures out which stores are High St location and which days are in the last week and adds all this together. Drilling down and rolling up just change what gets added together.
There are limits
The popularity of data cubes have come and gone and returned. They can be extremely useful when your data is large and has a mostly pre-defined set of questions that will be getting asked against it. But there are trade-offs.
One major drawback is that you’re working with limited data. Our example of drilling down from a week into specific days is a good case. What if the follow up was for an hourly breakdown? The cube doesn’t have hours, even though the data it used may have had that details.
A second limiter in data cubes is processing time. Processing all your data into the cube takes time and depending on how much data you have it can start to get long. That can often be sped up with more compute power but that costs money. These are not reasons to ignore data cubes, but considerations to include. Like many things in Data Science and Analytics there is a tradeoff between speed and flexibility.
Summary
We’ve taken a phrase that sounds pretty intimidating – hyperdimnesional data cube – and broken it down into some easier to understand concepts. These are ideas that will often come up as your managing and using data. Having this grounding will help you even if you’re not always working with a data cube.
